TIMEPLOT prints a timeplot of the input vector on the Statistics101 Output Window. A timeplot is a graph of the elements of the input vector in the same order they are in that vector. The input vector can have as many elements as desired since it prints down the page.
You can make graphical versions of the timeplot using the XYGRAPH and SCATTERGRAPH commands as shown at right.
See also the XYGRAPH and SCATTERGRAPH commands.
COPY 1,10 9,1 A
TIMEPLOT A
The above program produces the following output:
#	A
1	1.0	+
2	2.0	|    +
3	3.0	|          +
4	4.0	|               +
5	5.0	|                     +
6	6.0	|                          +
7	7.0	|                                +
8	8.0	|                                     +
9	9.0	|                                           +
10	10.0	|                                                +
11	9.0	|                                           +
12	8.0	|                                     +
13	7.0	|                                +
14	6.0	|                          +
15	5.0	|                     +
16	4.0	|               +
17	3.0	|          +
18	2.0	|    +
19	1.0	+
The next program reproduces the above timeplot using the graphical commands. The X values are not supplied by the graphical commands as they are by the TIMEPLOT command, so you must provided manually. In this case the X values are 1 through 19.
COPY 1,10 9,1 A
COPY 1,19 timePeriod
XYGRAPH timePeriod a
SCATTERGRAPH timePeriod a
You can use the SIZE command to compute the size of the input vector so you don't have to do it yourself:
SIZE A sizeA
XYGRAPH 1,sizeA A
Or, you can write a subroutine to do the above automatically and graph it at the same time:
NEWCMD TIMEGRAPH vec
SIZE vec vecSize
XYGRAPH "" " " 1,vecSize vec
END
and invoke it like this:
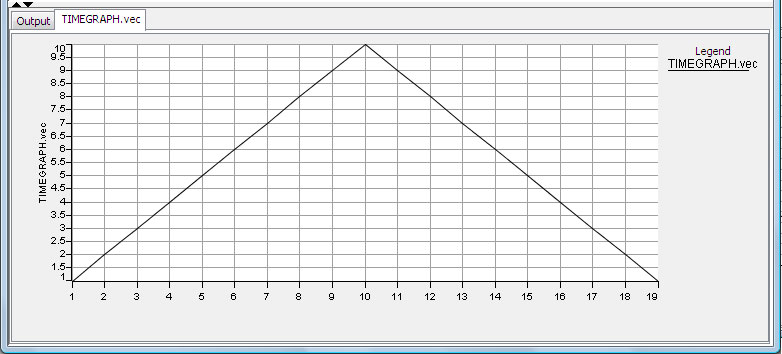
COPY 1,10 9,1 A
TIMEGRAPH a
to produce the following output: