Creates a histogram and displays it in a new graphical tab in the Output Panel. If there are multiple vectors in the argument list, each will be displayed on the same graph in different colors, all with the same range and bin size. To have Statistics101 scale each vector's histogram individually, use separate HISTOGRAM statements.
If the percent keyword is present, the y-axis will represent the number of samples in a bin as a percentage of the total number of samples. If the density keyword is present, the y-axis will represent the probability density, I.e., the bin frequency divided by the total number of samples divided by the bin width. If neither keyword is present, the y-axis will represent the number of samples in a bin.
The binsize keyword sets the width of each histogram bin to the number that follows the keyword. The number specifying the bin size may be a variable. If it is a literal number, it may be any decimal number and may be in scientific notation.
To set the desired number of bins, use the bins keyword followed by the desired number, which may be a variable or a literal number. The actual number of bins used may not be exactly the number specified because the program tries to choose bin sizes that are "easy" to read. If both the bins and binsize keywords are present, binsize is used and bins is ignored.
Note that the "bin start" value is included in the bin and the "bin end" value is excluded. That means that if the bin start is 1.0, then a value of 1.0 will be counted as being in that bin. If the bin end is 1.0, then a value of 1.0 will belong in the next bin.
The yscale keyword sets the upper limit of the histogram's Y axis. If you use yscale, you must follow it with a literalNumber or a variable.
The histogram chart is displayed in the Statistics101 output panel in a tab of its own. There are three titles or labels associated with the graph: the tab title, the Y-axis label, and the X-axis label. The optional keyword title establishes the title that is to be displayed in the graph's tab. It takes a literal string (enclosed in double quotes) or a string variable argument that becomes the tab's title. If the title keyword and its argument are omitted, then the tab's title will display the X-axis label. If there is no X-axis label, then the tab's title will be the name of the first input vector.
The axis labels are not associated with any keyword. They also are either literal strings or string variables. If they are present, they are assigned based on their order, the first being the Y-axis label and the second being the X-axis label. If the yAxisLabel is omitted, then the Y axis label defaults to one of the following: It defaults to "Frequency (%)" if the percent keyword is present. It defaults to "Density" if the density keyword is present, and to "Frequency" if both keywords are omitted.
If the xAxisLabel is omitted, the name of the first inputVector will be used as the X-axis label. The xAxisLabel is only allowed if it is preceded by a yAxisLabel. If you want to specify an xAxisLabel but you want to keep the default yAxisLabel, you can use an empty string ("") for the yAxisLabel, followed by the xAxisLabel. This maintains the required order. This is illustrated in the second example at right.
If you don't want a label for either or both axes, use a blank string (" ") for that axis or for both axes. Note the difference between a blank string and an empty string: the blank string has at least one blank in it and only blanks. The empty string has nothing between the two quote marks.
Your
input vectors are allowed to have NaN items in them. NaNs are counted
as part of the population but they are not plotted. As a result, the
bins that are plotted will not add up to 100%. You can eliminate NaNs
from your input vectors using the CLEAN command.
See also: HISTOGRAMPLOT and HISTOGRAMDATA.
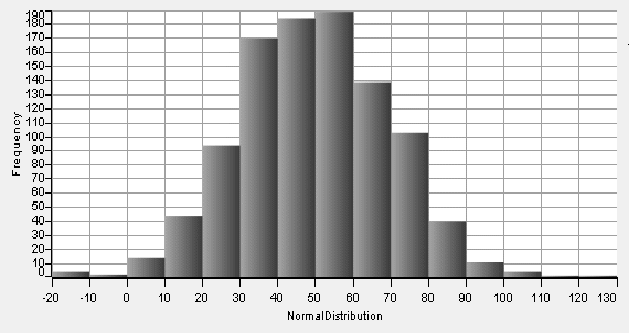
NORMAL 1000 50 20 NormalDistribution
HISTOGRAM NormalDistribution
The above program produced the following output on one run:
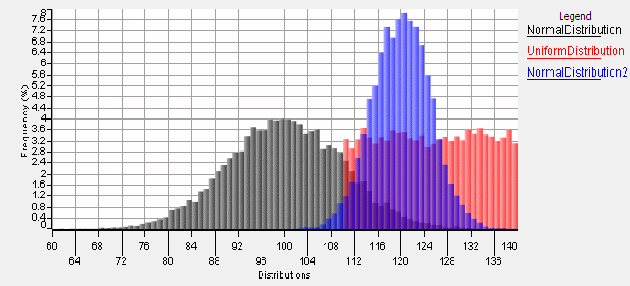
The next set of commands will create three histograms, one for each vector, all with the same bin size, x-scale, and y-scale and all on the same chart:
NORMAL 10000 100 10 NormalDistribution
UNIFORM 10000 110 140 UniformDistribution
NORMAL 10000 120 5 NormalDistribution2
HISTOGRAM binsize 1  percent "" "Distributions" NormalDistribution  UniformDistribution NormalDistribution2
Here is the result:

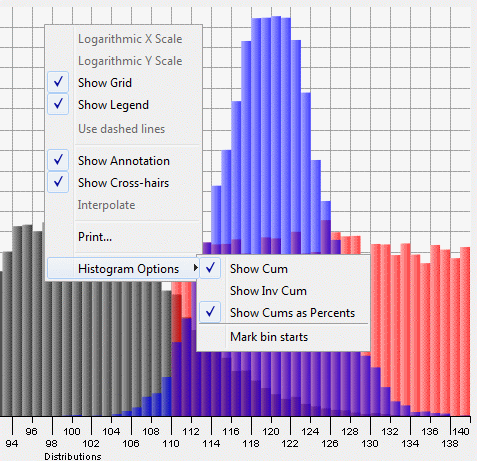
The histogram graph has a special submenu, Histogram Options, added to the graph's popup menu as you can see in this next figure:

The Histogram Options submenu allows you to choose whether or not the cumulative and/or inverse cumulative frequencies will be shown in the annotations that track the cursor when you move the cursor over the graph. You also can choose whether to show the frequencies as percents or not: If the "Show Cums as Percents" item is not checked, then the cum is simply the sum of all the bin frequencies up to and including the bin under the cursor. If the "Show Cums as Percents" item is checked, then the cum values shown will be the ratio of the sum of all bin frequencies up to and including the bin under the cursor to the total of all the bins, expressed as a percent. By default, the vertical crosshair that follows the cursor "sticks" at the midpoint of the bin under the cursor. If you select "Mark bin starts", the crosshair will instead stick at the left edge of the bin that the cursor is hovering over. That menu item's label will then change to "Mark bin centers" so that you can return to the default setting if you want to. The default selections in the submenu are those shown in the above figure.
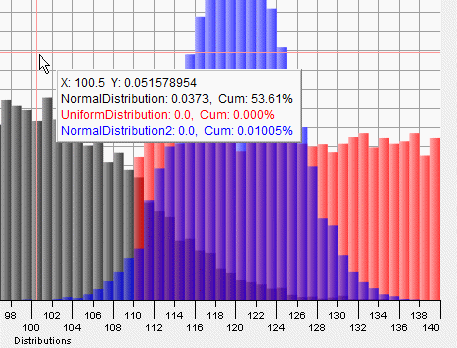
The next figure shows the cursor-tracking annotations. In this figure the cumulative frequency is displayed as a percentage, which is the result of the default selections of the Histogram Options submenu.

