A Bubble Graph or Bubble Chart is a form of scatter graph in which the points are located in X,Y space and the points' sizes are scaled in proportion to a third variable, Z. The BUBBLEGRAPH command creates a bubble chart of any number of vector triplets (xVector yVector zVector). The first vector of the triplet contains all the "X" values, the second vector contains all the "Y" values, and the third contains a set of "Z" values that will be represented as the radii or areas of disks or spheres ("bubbles") at each X,Y location. All three vectors of a triplet must be the same length.
The chart will by default have linear-scaled axes. If the log keyword is present, the graph's Y-axis will have a logarithmic scale. If the loglog keyword is present, both axes will have logarithmic scales. An exception is that if the X or Y data contains any values that are illegal for logarithms (i.e., they are negative or zero) then the keyword will be ignored for that axis and the scale will be linear.
By default the bubbles will be displayed with a three-dimensional effect as spheres. If you want them displayed as flat disks, then use the disks keyword.
There are two ways that the Z values may be interpreted: either as the areas of the bubbles or as the radii of the bubbles. You must choose which interpretation is to be used. If you choose to interpret the Z values as radii, then a circle whose Z value is twice that of another will appear to be four times the size of the other in area. That's because the area of a circle is proportional to the square of its radius. If you choose to interpret the Z values as areas, then a circle whose Z value is twice that of another will appear to be twice the size of the other. By default the Z values will be interpreted as areas. To have them be interpreted as radii, use the radii keyword. In the Planet example at right, the bubbles represent the planets, so doubling the radius should quadruple the disk area. Therefore the radii keyword is used.
Normally, all the elements of the zVector should be positive numbers. By default, if any elements of the zVector are 0 or negative they will be ignored, but any remaining positive elements will be displayed. The keyword showall will cause bubbles with both positive and negative Z values to be displayed (zero Z values will not be displayed under any circumstances). The negative bubbles will show up as colored circles with white interiors.
The chart is displayed in the Statistics101 Output Window in a tab of its own. There are three titles or labels associated with the graph: the tab title, the X-axis label, and the Y-axis label. The optional keyword title establishes the title to be displayed in the graph's tab. It takes a literal string (enclosed in double quotes) or a string variable argument that becomes the tab's title. If the title keyword and its argument are omitted, then the tab's title will display the Y-axis label. If there is no Y-axis label, then the tab's title will be the name of the first input yVector.
The axis labels, which may be literal strings (enclosed in double quotes) or string variables (not enclosed in quotes), are not associated with any keyword. If they are omitted, then the name of the first yVector becomes the Y-axis label and the name of the xVector becomes the X-axis label. If the axis labels are present, they are assigned based on their order, the first being the Y-axis label and the second being the X-axis label. If you want to specify an X-axis label but you want to keep the default Y-axis label (the name of the first yVector), you can use an empty string ("") as the Y-axis label, followed by the X-axis label. This maintains the required order.
If you don't want a label for either or both axes, use a blank string (" ") for that axis or for both axes. Note the difference between a blank string and an empty string: the blank string has at least one blank in it and only blanks. The empty string has nothing between the two quote marks.
Special Menu Options
The popup menu for graphs generated by this command has three extra options.
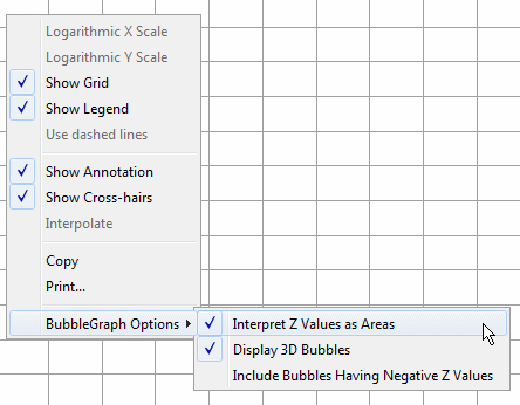
One option, "Interpret Z Values as Areas", toggles the display between interpreting Z values as areas and as radii. The second option, "Display 3D Bubbles", toggles the display between drawing the bubbles as disks or spheres. The third option, "Include Bubbles Having Negative Z Values", toggles between showing and not showing bubbles whose Z values are negative values. These are the same options that are set by the radii, disks, and showall keywords. The menu overrides the keywords. The default settings are shown.
Note that in graphs created by BUBBLEGRAPH, the Interpolate and the Use Dashed Lines menu items are disabled because they do not apply.
For details on the tabs, menus, and other features associated with graphs, see also: Graph Features .
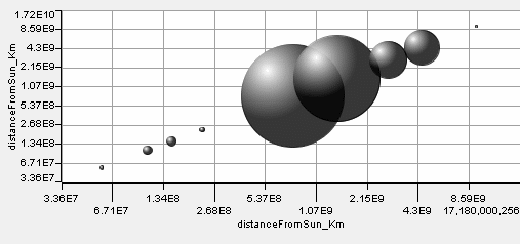
The following example program creates a bubble graph showing the nine planets in their relative sizes and distances from the sun (yes, I know that Pluto is no longer considered to be a planet):
DATA 5.79098629174E7 1.081997262424E8 1.49599579314E8 2.27939353702E8 7.7832832288E8 \
  1.42939647592E9 2.870982093E9 4.50428838428E9 9.50536758958048E9 distanceFromSun_Km
'Assign planet names to the radius values (radii are in Km):
NAME (2439.0   6052.0 6378.0 3393.5 71400.0 60000.0 25600.0 24300.0 1150.0 )  \
      Mercury  Venus  Earth  Mars   Jupiter Saturn  Uranus  Neptune Pluto
PlanetRadius = Mercury,Pluto
BUBBLEGRAPH RADII LOGLOG  TITLE "BubbleGraph" DistanceFromSun_Km distanceFromSun_Km planetRadius
Here is the output from the above program.
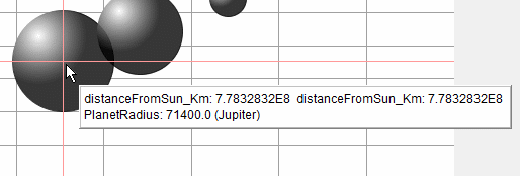
Note that as in the program above, if you assign names to the Z values (using the NAME or CONST command) then those names will appear in the annotation for each bubble. Here's the annotation that appears when the pointer is held over Jupiter's bubble: